
Introduction
The Diagnostics Charting Tool is a power application that allows a technician to record and plot low level inputs and outputs from the ProtoTRAK control. This is particularly useful for looking at fast changing I/O’s, or ones that would be otherwise hard to see or measure.
The example below goes over how to use the tool for troubleshooting a rigid tapping cycle. However, please note that the DCT can be used to monitor any scenario. The guide below also explains how to familiarize yourself with the tool.
-
-
Please set up a tapping program, and have it ready to run before proceeding with the next steps.
-
The use of a mouse is also highly recommended; however, it is possible to navigate with the touchscreen on the control. Instead of right clicking with a mouse, simply press and hold on the touchscreen to emulate a right button mouse click.
-
To launch the TRAK Diagnostic Charting Tool, go to "SETUP," then "SERV CODES." On the "Service Codes" screen, type "522", hit "ABS SET," and press "OK."
-
This should open the TRAK DCT window, and the ProtoTRAK software should remain running in the background.
-
-
-
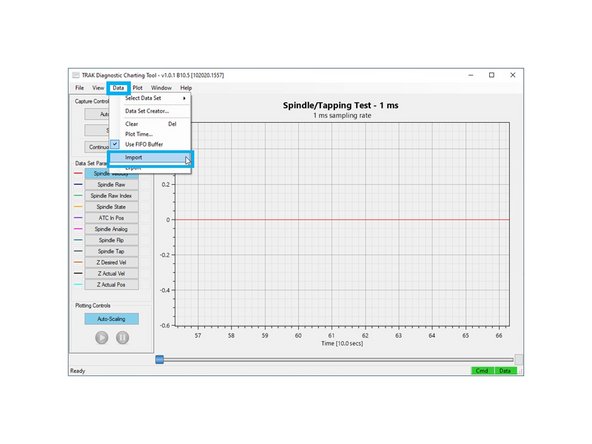
In the DCT window, click on "Data", then "Select Data Set," and then "Spindle/Tapping Test - 1ms."
-
The Data Sets are pre-selected groups of commonly used inputs and outputs within the ProtoTRAK control.
-
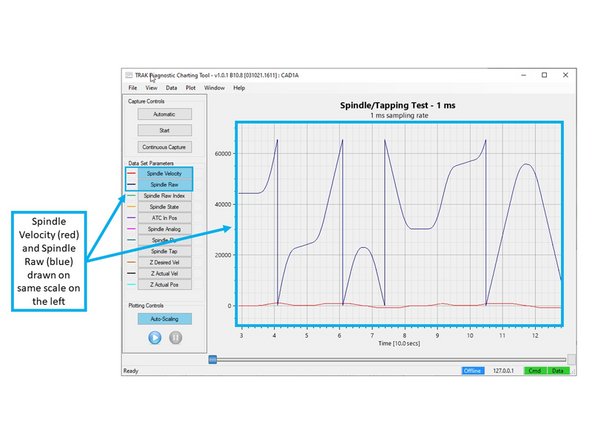
When the DCT window goes back to the main screen, make sure that the chosen Data Set Parameters for the Spindle/Tapping Test are displayed on the left side of the screen (as shown on the image).
-
Also, note that the title of the screen has now changed to "Spindle/Tapping Test - 1 ms."
-
Click on the "Spindle Velocity" parameter from the list of parameters on the left; it should be the only parameter highlighted in blue. Note that only the parameters that are highlighted will be the only ones actually drawn in the graph.
-
-
-
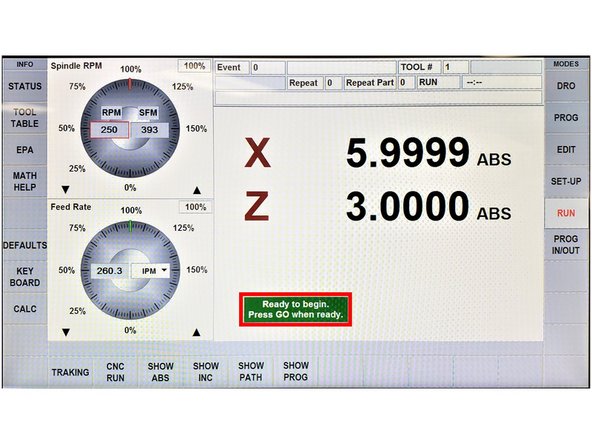
Make sure that the machine is ready to run the tapping test. Ideally, have the machine be ready to run, so that all you need to do is press "GO."
-
Use "ALT + TAB" on the keyboard to switch back to the ProtoTRAK software if necessary.
-
As the DCT records, the ProtoTRAK software will be very slow to respond, because the DCT will be capturing every millisecond. Have as little interaction between the two programs as possible.
-
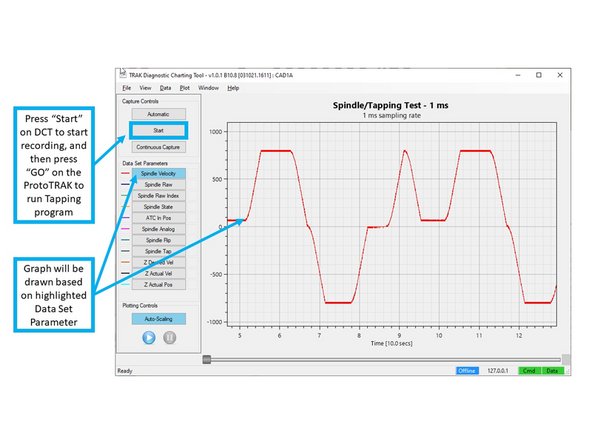
Press "Start" on the DCT window to begin recording. As shown on the image, a graph will be drawn on the main window, which will show whatever Data Set Parameter is highlighted (which, in this particular case, is Spindle Velocity).
-
Press "GO" on the ProtoTRAK's front panel to start running the Tapping program.
-
The graph on the image shows an example of the Spindle Velocity (RPM) that is currently being ran in the tapping program. As shown on the image, the red line goes to +800 for FWD motion, and -800 for REV motion of the spindle.
-
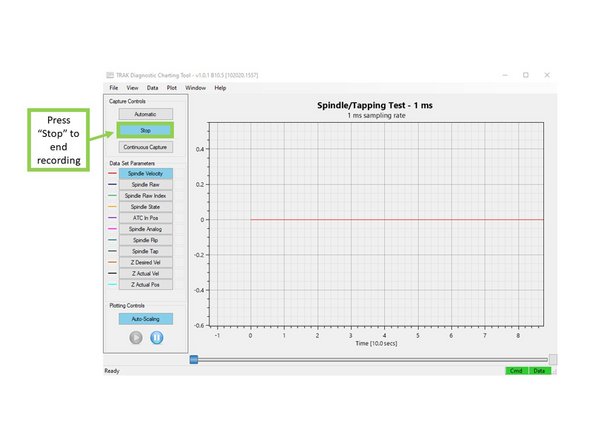
Once the program completes its run, press "Stop" on the DCT window to stop recording. The DCT is only capable of reliably recording for a minute or two, so keep the tapping program short.
-
Please note that running a specific tapping cycle is not needed in order to capture data; this data set can also be used for any scenario where you can simply monitor the spindle speed. Please note that while the ProtoTRAK machine can also be sitting idle, and the spindle can be turned on and off, it will still record the data shown.
-
-
-
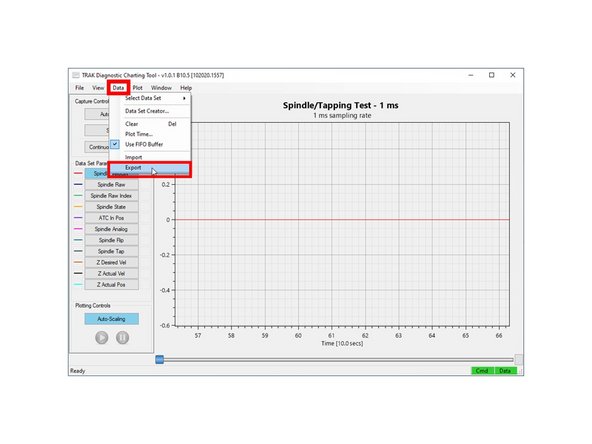
To save the data, click on "Data," then "Export," and then save the filename to your USB flash drive.
-
For example, try to give it a descriptive name to keep track of what your RPM and pitch were, or give it a description of what kind of problem you saw.
-
The DCT records all parameters that are listed on the left side of the screen, not just the ones that are highlighted or drawn. Parameters can be enabled or disabled even after the DCT has recorded them.
-
In addition, the data that is exported will only be from the last timeframe where "Start" and "Stop" were pressed.
-
To import previously saved data, click on "Data," and then "Import." A browser window will appear, and it will prompt you to open your file.
-
After opening the file, the main window should automatically update to whatever parameters were saved with the data.
-
-
-
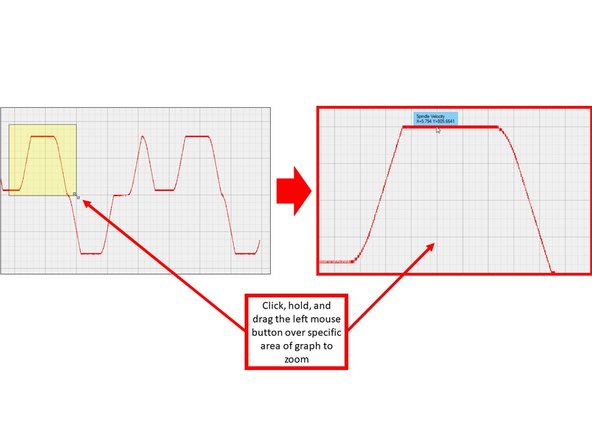
To zoom in on a particular area of the graph, simply click and hold the left mouse button as you point the cursor at one corner of that area, then drag the mouse over and release on the opposite corner. You should see a yellow highlighted area that indicates that area that you will zoom into.
-
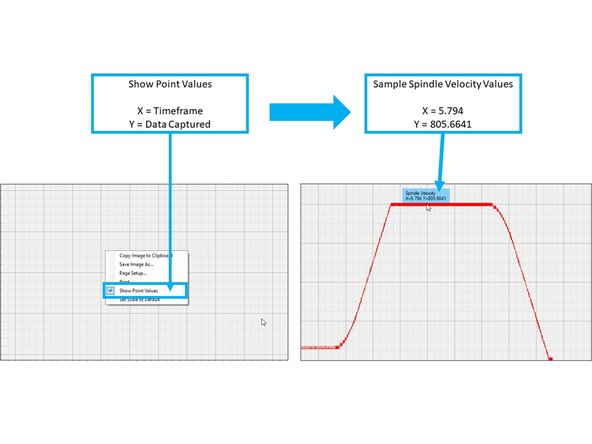
Enable "Show Point Values" by right clicking anywhere on the main graph window, and selecting it on the menu that appears. "Show Point Values" allows you to see the parameter and the X and Y values of a specific area on the graph when you hover over that area with your mouse cursor.
-
Note that "X" is always time, and "Y" is always the data that you captured.
-
The image shows a timeframe of 5.794 seconds and 805.6641 RPM of the Spindle Velocity.
-
The example in both images above shows how valuable the zooming function is to accurately measure any abnormal spindle speed fluctuations. Both images zoom into where the spindle is reversing direction at the bottom of the tapped hole to make sure it behaved smoothly.
-
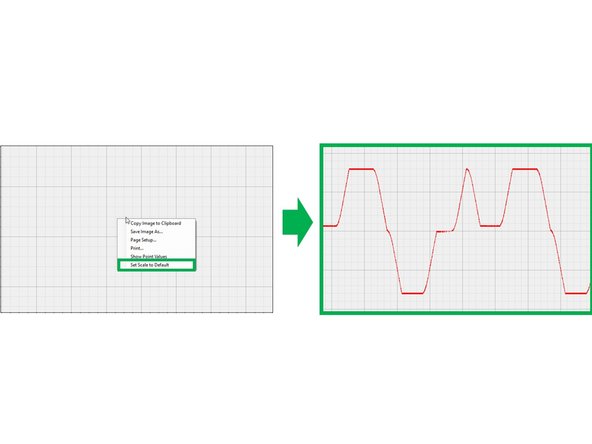
To restore the view of the window to auto fit everything in the graph, right click on the graph, and select "Set Scale to Default."
-
-
-
By default, all data that you record will be scaled equally. For example, if you have one parameter that displays a small value, and another parameter in the thousands, the first parameter will appear to be drawn almost flat, because they are being drawn on the same scale.
-
The image shows both Spindle Velocity (RPM) and Spindle Raw (encoder) being graphed together. Because RPM only goes as high as 800, and the Spindle Raw goes up to ~65,000, the RPM is harder to discern (drawn in red on the image). You could zoom in on the velocity, but you will not be able to see the encoder count.
-
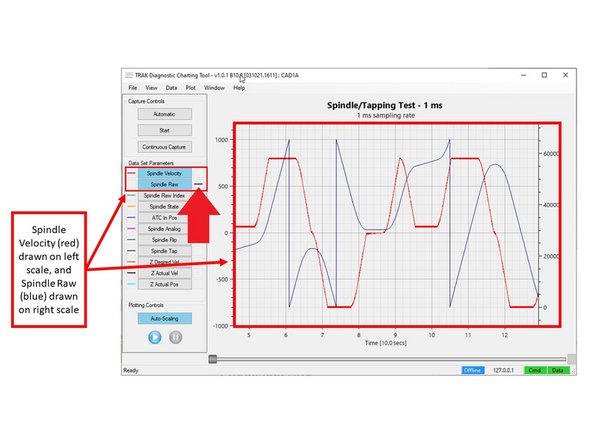
If you click on the right side of the Spindle Raw parameter (please see image), the blue line will move to the right side, and the main window will redraw itself with another scale on the right side.
-
The scale on the right will be for the Spindle Raw parameter, and the scale on the left will be for the Spindle Velocity parameter; the two parameters are drawn with their own specific scale. In addition, they are easier to discern from each other, as you can see more clearly what one is doing at the same time as the other.
-
-
-
The DCT software can also be used offline, and can import data taken from machines.
-
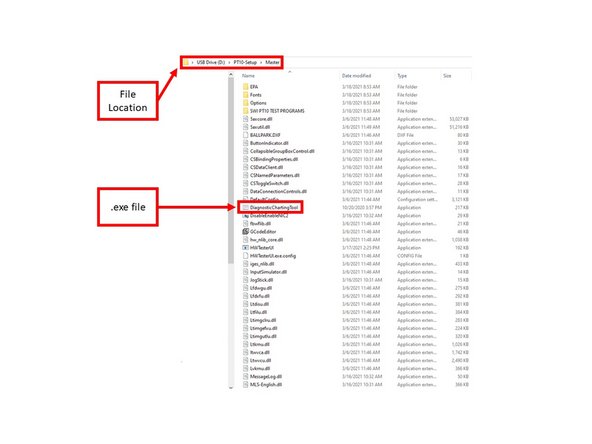
Plug in a USB flash drive that contains the latest software download, as well as the data file that was saved.
-
Open the drive, and go into the PT10-Setup > Master Folder, and double click on the DiagnosticChartingTool.exe file to open the app.
-
Once the DCT app opens, click on "Data," and then "Import" to browse for the data file, and then click on "Open."
-
-
-
The DCT is a constant work in progress, and therefore has some known bugs. If, at any point, this software window appears to stop responding, or stops drawing the graph, simply close and relaunch it using Service Code 522.
-
If you come across an input that never appears to record or draw correctly, please report it to the Service Department, so that it can be looked into.
-
Please also note that our software will default to whatever units that TRAK Machine Tools uses internally. For example, all "Actual Position" parameters are going to be in millimeters.
-


Cancel: I did not complete this guide.
One other person completed this guide.